


Why Is Your CS-Cart Store Slow?
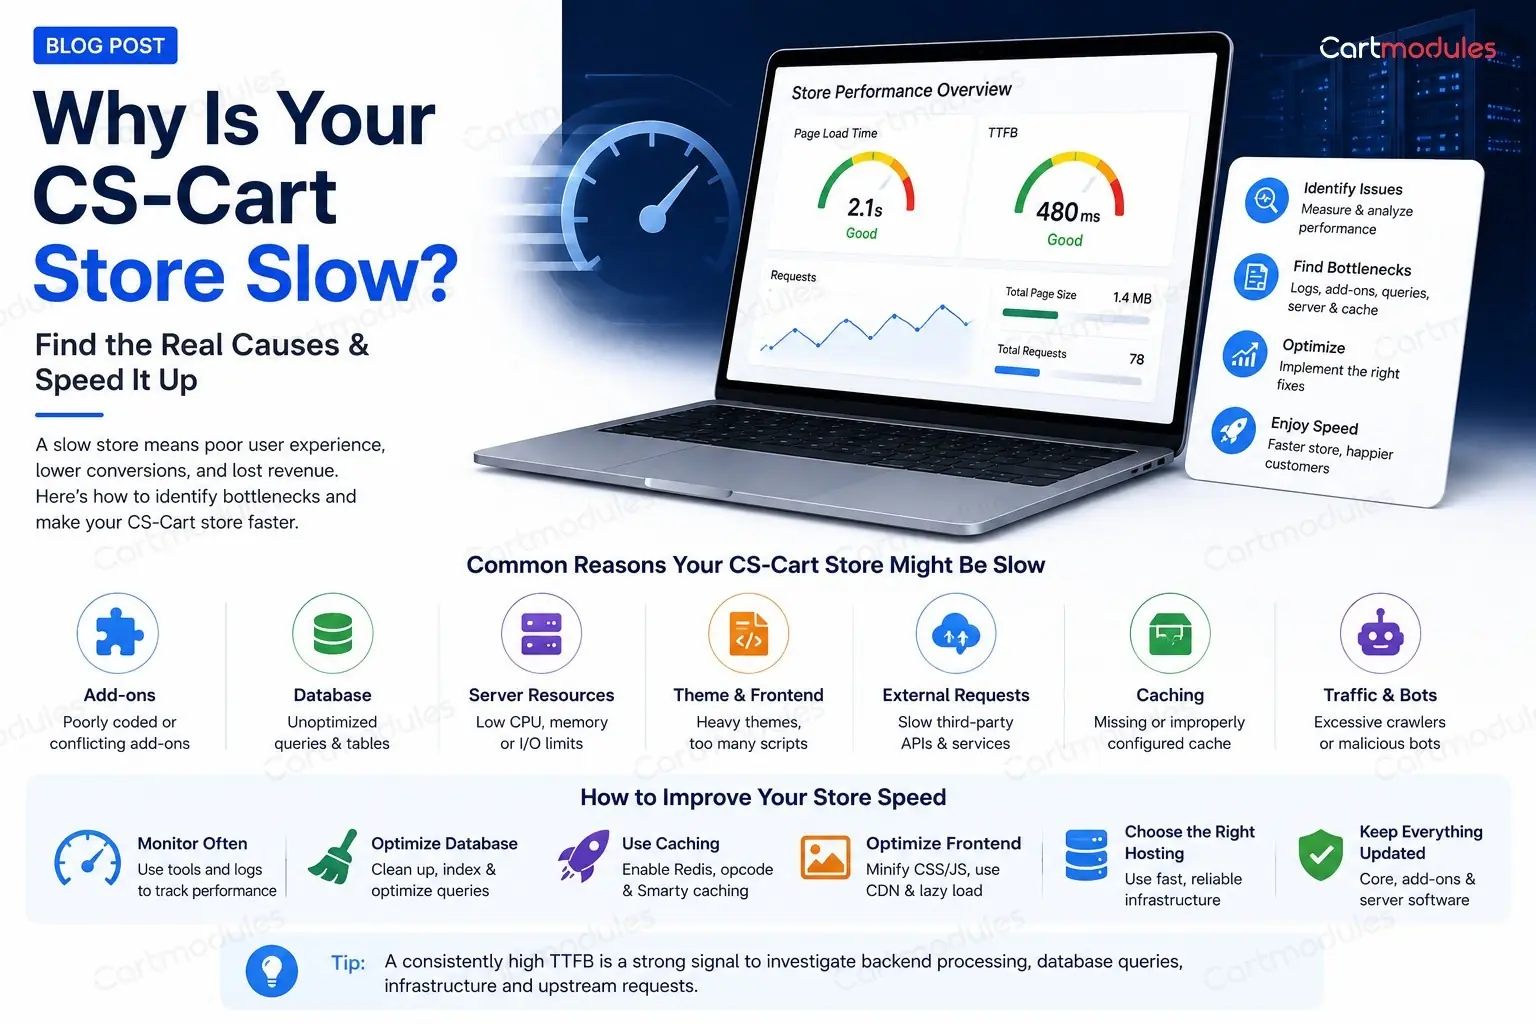
Your host says you need a bigger plan. They might be right. But we've moved a lot of slow CS-Cart stores onto bigger servers and watched them stay slow, because the problem was one add-on, one query, or one background request quietly waiting for a timeout.
This post is about the step before the fixes: working out what's actually wrong. If you already know the cause, CS-Cart's own guide to server tuning covers PHP versions, OPcache, PHP-FPM, NGINX, MySQL and Redis well, and there's no point us rewriting it. This is about the diagnosis.
First, ask a better question
"The site is slow" is too vague to act on. Narrow it down before you touch anything.
Is it the storefront or the admin panel? They have almost nothing in common performance-wise. The storefront is heavily cached and mostly read. The admin panel is barely cached and full of writes, joins and counts. A slow storefront and a slow admin usually have entirely different causes.
Is it every page or specific pages? A slow product page and a slow category page point in different directions. A slow checkout is different again.
Is it slow all the time, or in bursts? Constant slowness suggests a query, a config problem, or genuinely undersized hardware. Bursts suggest traffic (real or otherwise) or a cron job stepping on the site.
Is it slow for everyone, or just logged-in users? Full-page caching only serves anonymous visitors. If your store is fast until someone logs in, your cache is working and the uncached path is the problem.
When did it start? Right after an upgrade, a new add-on, a traffic spike, or a catalogue import? The change that broke it is usually the last thing that changed.
Write the answers down. They'll cut your search in half.
Measure it, don't feel it
Use CS-Cart's own debug mode
CS-Cart can show you where the time goes on a given page. With debug mode turned on you get a breakdown of how long each block took to render, how many database queries ran, and how much memory was used. How you switch it on depends on your version and settings, so check the CS-Cart docs for yours.
This is the single most useful tool available and most store owners have never opened it.
What you're looking for:
- A single block eating most of the time. That's your suspect, and it usually belongs to an add-on
- A query count in the thousands. Any page firing thousands of queries has a problem in its data access, not on the server
- Memory close to your PHP limit. Raising the limit will stop the crashes and won't make it fast
Time the page from outside
Before you change anything, get a number you can compare against later:
curl -o /dev/null -s -w "dns=%{time_namelookup}s connect=%{time_connect}s ttfb=%{time_starttransfer}s total=%{time_total}s\n" https://yourstore.com/
Time to first byte is one of the most useful numbers to start with. It's how long your server took to think. If TTFB is 3 seconds, no amount of image optimisation or CDN work will save you. A consistently high TTFB is a strong signal to investigate backend processing, database queries, infrastructure and upstream requests.
If TTFB is fast and the page still feels slow, your problem is front-end: images, scripts, fonts, third-party tags. That's a different post.
Run it a few times. The first hit may be uncached.
Check whether caching is on at all
More stores than you'd think are running with caching disabled or misconfigured after a migration. Confirm which cache backend you're using and that it's actually connected. If you use full-page caching, check that pages are being served from it rather than rebuilt every time.
Three real cases worth knowing about
These are things that have genuinely bitten CS-Cart stores, and they illustrate why "buy a bigger server" is so often the wrong answer.
The admin panel waiting on an outbound request
A store owner reports the admin panel takes a minute per page. Server load is fine. Database is fine.
The cause: CS-Cart making a synchronous outbound HTTP request during page render, a call out to cs-cart.com for a licence-check image. Normally it takes milliseconds and nobody notices.
But if that outbound request can't complete, the page render sits and waits for the full timeout. And the reason it can't complete is often a firewall configured to DROP rather than REJECT outbound traffic. A REJECT fails instantly. A DROP means the connection hangs until it times out, and your admin page hangs with it.
Two fixes: turn off the "monitor core changes" setting that triggers the check, or change the firewall to REJECT so the failure is immediate.
The lesson: a slow page is not always a busy page. Sometimes it's a page that is doing nothing, waiting for something else.
An add-on firing thousands of queries on one screen
A case reported on the CS-Cart forum: a store's product edit page in the admin was crawling, and debug output showed roughly 4,000 SQL queries on a single page load, traced to the Required Products add-on. We're repeating someone else's report here rather than a store we measured, but the shape of it is worth knowing.
No server upgrade fixes 4,000 queries. You either fix the add-on's data access, or you turn it off.
The lesson: query count is a better signal than query time. One thousand fast queries will beat you as surely as one slow one.
Scrapers hammering the pages nobody caches
Product comparison, filter combinations and search URLs make an endless number of unique URLs. They're also usually excluded from full-page caching, because the output differs per visitor.
Point a scraper at them and every single request goes straight through to PHP and the database. CPU sits at 100%, real customers get slow pages, and your traffic reports show nothing unusual because most analytics don't count bots.
The lesson: look at your access logs, not just your analytics. Analytics shows you people. Logs show you everything.
Working through it
Step 1: look at the access log
Before blaming code, find out what's actually hitting the site.
Top IPs today:
awk '{print $1}' /var/log/nginx/access.log | sort | uniq -c | sort -rn | head -20
If one IP has made tens of thousands of requests, there's your traffic problem.
Most-requested URLs:
awk '{print $7}' /var/log/nginx/access.log | sort | uniq -c | sort -rn | head -30
Look for dispatch=products.search, comparison URLs, or filter URLs with long query strings near the top. Real customers don't browse like that.
Slowest requests, if your log format includes request time:
awk '$NF > 5 {print $NF, $7}' /var/log/nginx/access.log | sort -rn | head -30
Step 2: audit your add-ons
In our experience add-ons are one of the most common causes of a slow CS-Cart store, and the easiest thing to test.
On a staging copy (never on live), disable your third-party add-ons and time a page. Then re-enable them one at a time, timing after each.
Yes, it's tedious. It also finds the problem more reliably than anything else, and it takes an afternoon.
Things to be suspicious of:
- Anything that runs on every page load rather than the page it belongs to
- Anything doing an outbound API call during page render: currency rates, stock checks, personalisation, live shipping rates
- Anything added around the time the slowness started
- Add-ons from a vendor who has stopped updating them
Live shipping rate lookups at checkout deserve special mention. If a carrier's API is slow, your checkout is slow, and there's nothing wrong with your server at all.
Step 3: read the slow query log
You don't need to be a DBA. Switch on MySQL's slow query log with a threshold of a second or two, leave it for a day, then look at what's in it.
You're looking for the same query appearing over and over, not the single slowest one. A query taking 4 seconds once a day matters less than one taking 200ms that runs 50,000 times.
Common CS-Cart offenders:
- Product searches across a large catalogue with several filters applied. This is where an external search service like Algolia takes the load off your database entirely
- Anything joining products to features, options and variants at once
- Reporting queries in the admin panel over a wide date range
- Queries added by an add-on that didn't add an index to go with its new table
Once you've got the query, EXPLAIN it. If it says it's scanning hundreds of thousands of rows to return twelve, you need an index. A bigger server won't help.
Step 4: now consider the server
If you've ruled out add-ons, traffic and queries, look at the box.
Check whether you're actually resource-constrained rather than assuming it:
toporhtopduring a slow period: is CPU pegged, and by what?free -m: are you swapping? Swapping makes everything catastrophically slow and looks like a hundred other problemsdf -handdf -i: a full disk is obvious, but running out of inodes is not, and CS-Cart's cache directory generates an enormous number of small files- Database connections: are you hitting
max_connections?
Only when you can point at a specific resource running out does "bigger server" become the right answer. Then the things worth doing are the ones in CS-Cart's own tuning guide: a current PHP version, OPcache on and sized properly, PHP-FPM workers matched to your memory, and MySQL's buffer pool sized for your data.
Step 5: caching, in the right order
Roughly in order of effort-to-payoff:
Opcode cache (OPcache). Should already be on. Check it is, and that it isn't full. A full OPcache silently stops helping.
Object cache on Redis. Moving CS-Cart's cache off the filesystem onto Redis is often the highest-impact change for stores where filesystem caching has become the bottleneck, and it removes the inode problem at the same time.
Full-page cache. Serving anonymous visitors a cached page means most of your traffic never touches PHP. The catch is that it only helps logged-out users, and you have to be careful about what varies: currency, language, storefront. Get that wrong and you'll serve the wrong price to the wrong person, which is worse than being slow.
A CDN for static files. Real, but smaller than people expect, and it does nothing for TTFB.
Things people do that don't help
Buying a bigger server for a query problem. Doubles your bill, buys you maybe 20%, and the problem comes back as you grow.
Raising PHP's memory limit to fix a slow page. That fixes crashes, not speed.
Turning off all caching to "rule it out". Guarantees slowness and tells you nothing.
Clearing the cache constantly. If clearing the cache fixes it for ten minutes, you have a cache invalidation problem. Clearing it more often just spreads the cost around.
Optimising images when TTFB is 4 seconds. Worth doing eventually. Fixes nothing today.
A short version
- Storefront or admin? Everyone or logged-in only? When did it start?
- Measure TTFB. Consistently over about a second points you at the backend rather than the front end
- Run debug mode on a slow page. Look at block timings and query count
- Read the access log. Find bots and hot URLs
- Disable add-ons on staging, re-enable one at a time
- Turn on the slow query log for a day
- Only then look at hardware
- Object cache on Redis, then full-page cache for anonymous visitors
When to hand it over
If you've done all of that and you're stuck, or you've found the problem and it's inside an add-on you can't change, that's the point to get help.
We do performance work and server support for CS-Cart stores, and the honest thing to say is that most of the time it isn't the server. It's one add-on, one missing index, or one outbound call that hangs. Finding it takes a couple of hours. Buying a bigger server takes a couple of minutes and often doesn't work.
If your store is slow and you'd rather someone just told you why, send us the details.
Common questions
Sometimes, but far less often than hosts suggest. If the cause is one add-on firing thousands of queries, a missing database index, or a page waiting on an outbound request that times out, a bigger server changes almost nothing and you keep paying for it every month. Diagnose first.
Time to first byte is the number to watch. Consistently over about a second is a strong signal to look server-side: backend processing, queries and upstream requests, before a single byte reached the browser. If TTFB is fast and the page still feels slow, the problem is front-end: images, scripts, fonts, third-party tags. That's a different job.
They have almost nothing in common. The storefront is heavily cached and mostly reads. The admin panel is barely cached and full of writes, joins and counts. A slow admin usually points at an add-on, a reporting query, or an outbound request hanging during page render.
For stores where the file cache has become the bottleneck, this is often the highest-impact change, and it removes the inode problem at the same time, because CS-Cart's file cache generates an enormous number of tiny files. It's normally less work than people expect.
Don't. Disabling add-ons one at a time on a trading store will break checkout for real customers at some point during the test. Do it on a staging copy with the full database. Problems only show at real catalogue size.


